 Statistiques
coupe du monde Football : résultats depuis 1930
|
Année |
Vainqueur |
Finaliste |
Score |
Meilleur
buteur |
Organisateur |
|
1930 |
 Uruguay
 |
 Argentine
 |
4-2 |
 Guillermo Stabile (8)
 |
 Uruguay
 |
|
1934 |
 Italie
 |
 Tchécoslovaquie
 |
2-1 a.p. |
 Oldřich Nejedlý (5)
 |
 Italie
 |
|
1938 |
 Italie
 |
 Hongrie
 |
4-2 |
 Leônidas da Silva (7)
 |
 France
 |
|
1950 |
 Uruguay
 |
 Brésil
 |
2-1 |
 Ademir Menezes (8)
 |
 Brésil
 |
|
1954 |
 R.F.A
R.F.A |
 Hongrie
 |
3-2 |
 Sándor Kocsis (11)
 |
 Suisse
 |
|
1958 |
 Brésil
 |
 Suède
Suède |
5-2 |
 Just Fontaine (13)
 |
 Suède
Suède |
|
1962 |
 Brésil
 |
 Tchécoslovaquie
 |
3-1 |
 Dražan Jerković (5)
 |
 Chili
Chili |
|
1966 |
 Angleterre
 |
 R.F.A
R.F.A |
4-2 a.p. |
 Eusébio (9)
 |
 Angleterre
 |
|
1970 |
 Brésil
 |
 Italie
 |
4-1 |
 Gerd Müller (10)
 |
 Mexique
 |
|
1974 |
 R.F.A
R.F.A |
 Pays-Bas
 |
2-1 |
 Grzegorz Lato (7)
 |
 R.F.A
R.F.A |
|
1978 |
 Argentine
 |
 Pays-Bas
 |
3-1 a.p. |
 Mario Kempes (6)
 |
 Argentine
 |
|
1982 |
 Italie
 |
 R.F.A
R.F.A |
3-1 |
 Paolo Rossi (6)
 |
 Espagne
 |
|
1986 |
 Argentine
 |
 R.F.A
R.F.A |
3-2 |
 Gary Lineker (6)
 |
 Mexique
 |
|
1990 |
 Allemagne
 |
 Argentine
 |
0-0 tab |
 Salvatore Schillaci (6)
 |
 Italie
 |
|
1994 |
 Brésil
 |
 Italie
 |
0-0 tab |
 Stoitchkov Stoitchkov
 Salenko
(6) Salenko
(6) |
 U.S.A.
 |
|
1998 |
 France
 |
 Brésil
 |
3-0 |
 Davor Šuker (6)
 |
 France
 |
|
2002 |
 Brésil
 |
 R.F.A
R.F.A |
2-0 |
 Ronaldo (8)
 |

 C&J
C&J |
|
2006 |
 Italie
 |
 France
 |
1-1 tab |
 Miroslav Klose (5)
 |
 Allemagne
 |
|
2010 |
 Argentine ?
 |
 Espagne ?
 |
2-1 ? |
 Lionnel Messi
(7) ?
 |
 A.D.S.
 |
 Statistique
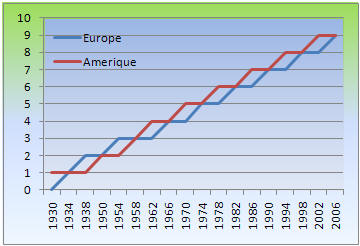
Coupe du monde : Vainqueur selon le continent
|
Analyse |
Interprétation graphique |
 Vainqueurs Continent Europe :
9 coupes du monde. 50 % du temps, la coupe est
donc revenue à un pays Européen.
La répartition est la suivante :
 Italie
: 4 Italie
: 4
 Allemagne: 3
 Angleterre : 1
 France : 1
 Vainqueurs
Continent Amérique
Egalité avec l'Europe avec
également 9 trophées :
 Brésil : 5 Brésil : 5
 Argentine : 2
 Uruguay
: 2 Uruguay
: 2
 Vainqueurs
Afrique, Océanie, Asie
Aucune victoire, aucune
finale.
|

 Notes
Notes
Depuis
1962 et le doublé du Brésil, la coupe du
monde
n'a jamais été attribuée 2 éditions de suite à un pays
de même continent. |
 Statistiques
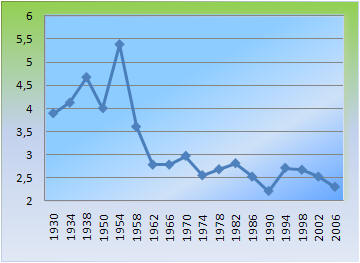
Coupe du monde : Moyennes de buts
|
Analyse |
Interprétation
graphique |
 Nombre de
matchs et moyenne buts
 Uruguay 1930 :18 matchs - 3,89
buts / match
 Italie 1934 :17 matchs - 4,12 buts
/ match
 France 1938 :18 matchs - 4,67
buts / match
 Uruguay 1950 :22 matchs - 4,00
buts / match
 Suisse 1954 : 26 matchs - 5,38
buts / match
 Suède 1958 : 35 matchs - 3,60
buts / match
 Chili 1962 : 32 matchs -
2,78 buts / match
 Anglet. 1966 : 32 matchs - 2,78
buts / match
 Mexi. 1970 : 32 matchs - 2,97 buts
/ match
 R.F.A 1974 : 38 matchs - 2,55 buts
/ match
 Argentine 1978 : 38 matchs -
2,68 buts / match
 Espagne 1982 : 52 matchs - 2,81
buts / match
 Mexique 1986 : 52 matchs - 2,52
buts / match
 Italie 1990 : 52 matchs - 2,21
buts / match
 U.S.A 1994
: 52 matchs - 2,71 buts /
match
 France 1998 : 64 matchs - 2,67
buts / match

 C&J 2002
: 64 matchs - 2,52 buts /
match
 Allema. 2006 : 64 matchs - 2,30
buts / match
|

 Notes
: Notes
:
Le
football se professionnalise mondialement à
partir des
années 1960. Le niveau général des équipes s'en retrouve
niveler vers le haut et la moyenne de buts par match se
stabilise en dessous de 3.
|
|

